The Dashboard is the top of your homepage and is the tool to give you and your colleagues a quick overview of the current state of your organization, view it on your homepage or have it emailed to you.
A Dashboard consists of 4 elements:
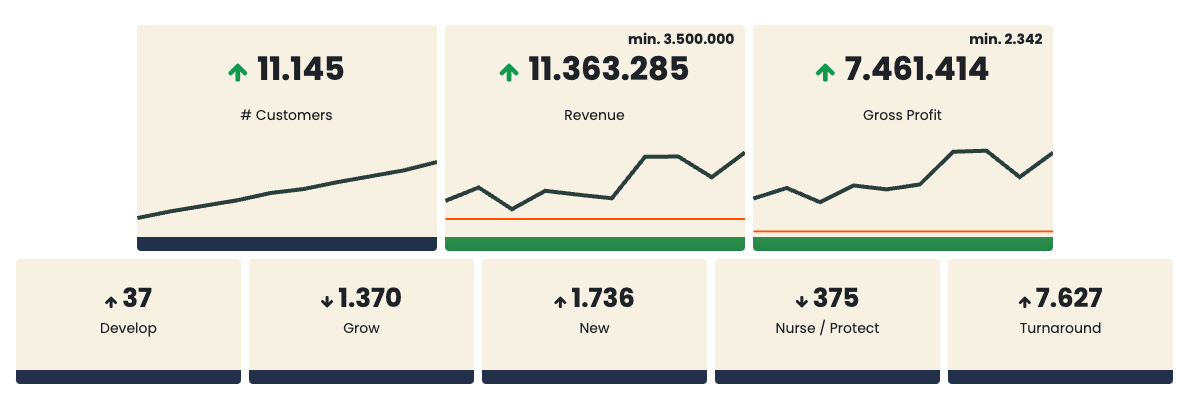
- KPI – It’s up to you how many KPIs you want to display in your Dashboard.
- Target – Set a target for each KPI and activate the alert.
- Alarm – Lights green if you are above target and red if you are below target. The alarm turns blue if you have not set a target for your KPI.
- Table – The table will only be visible if you access the Dashboard from the Dashboard menu (if enabled) or from your email (read more here)
The table is a great tool to get a drill down overview of your KPIs in your Dashboard.
Dashboards can be set up for Teams and/or Individuals in our Dashboard Creator. Read more in the article here.
NB: You can always click on a Widget that will take you to the Insights the number is based on.