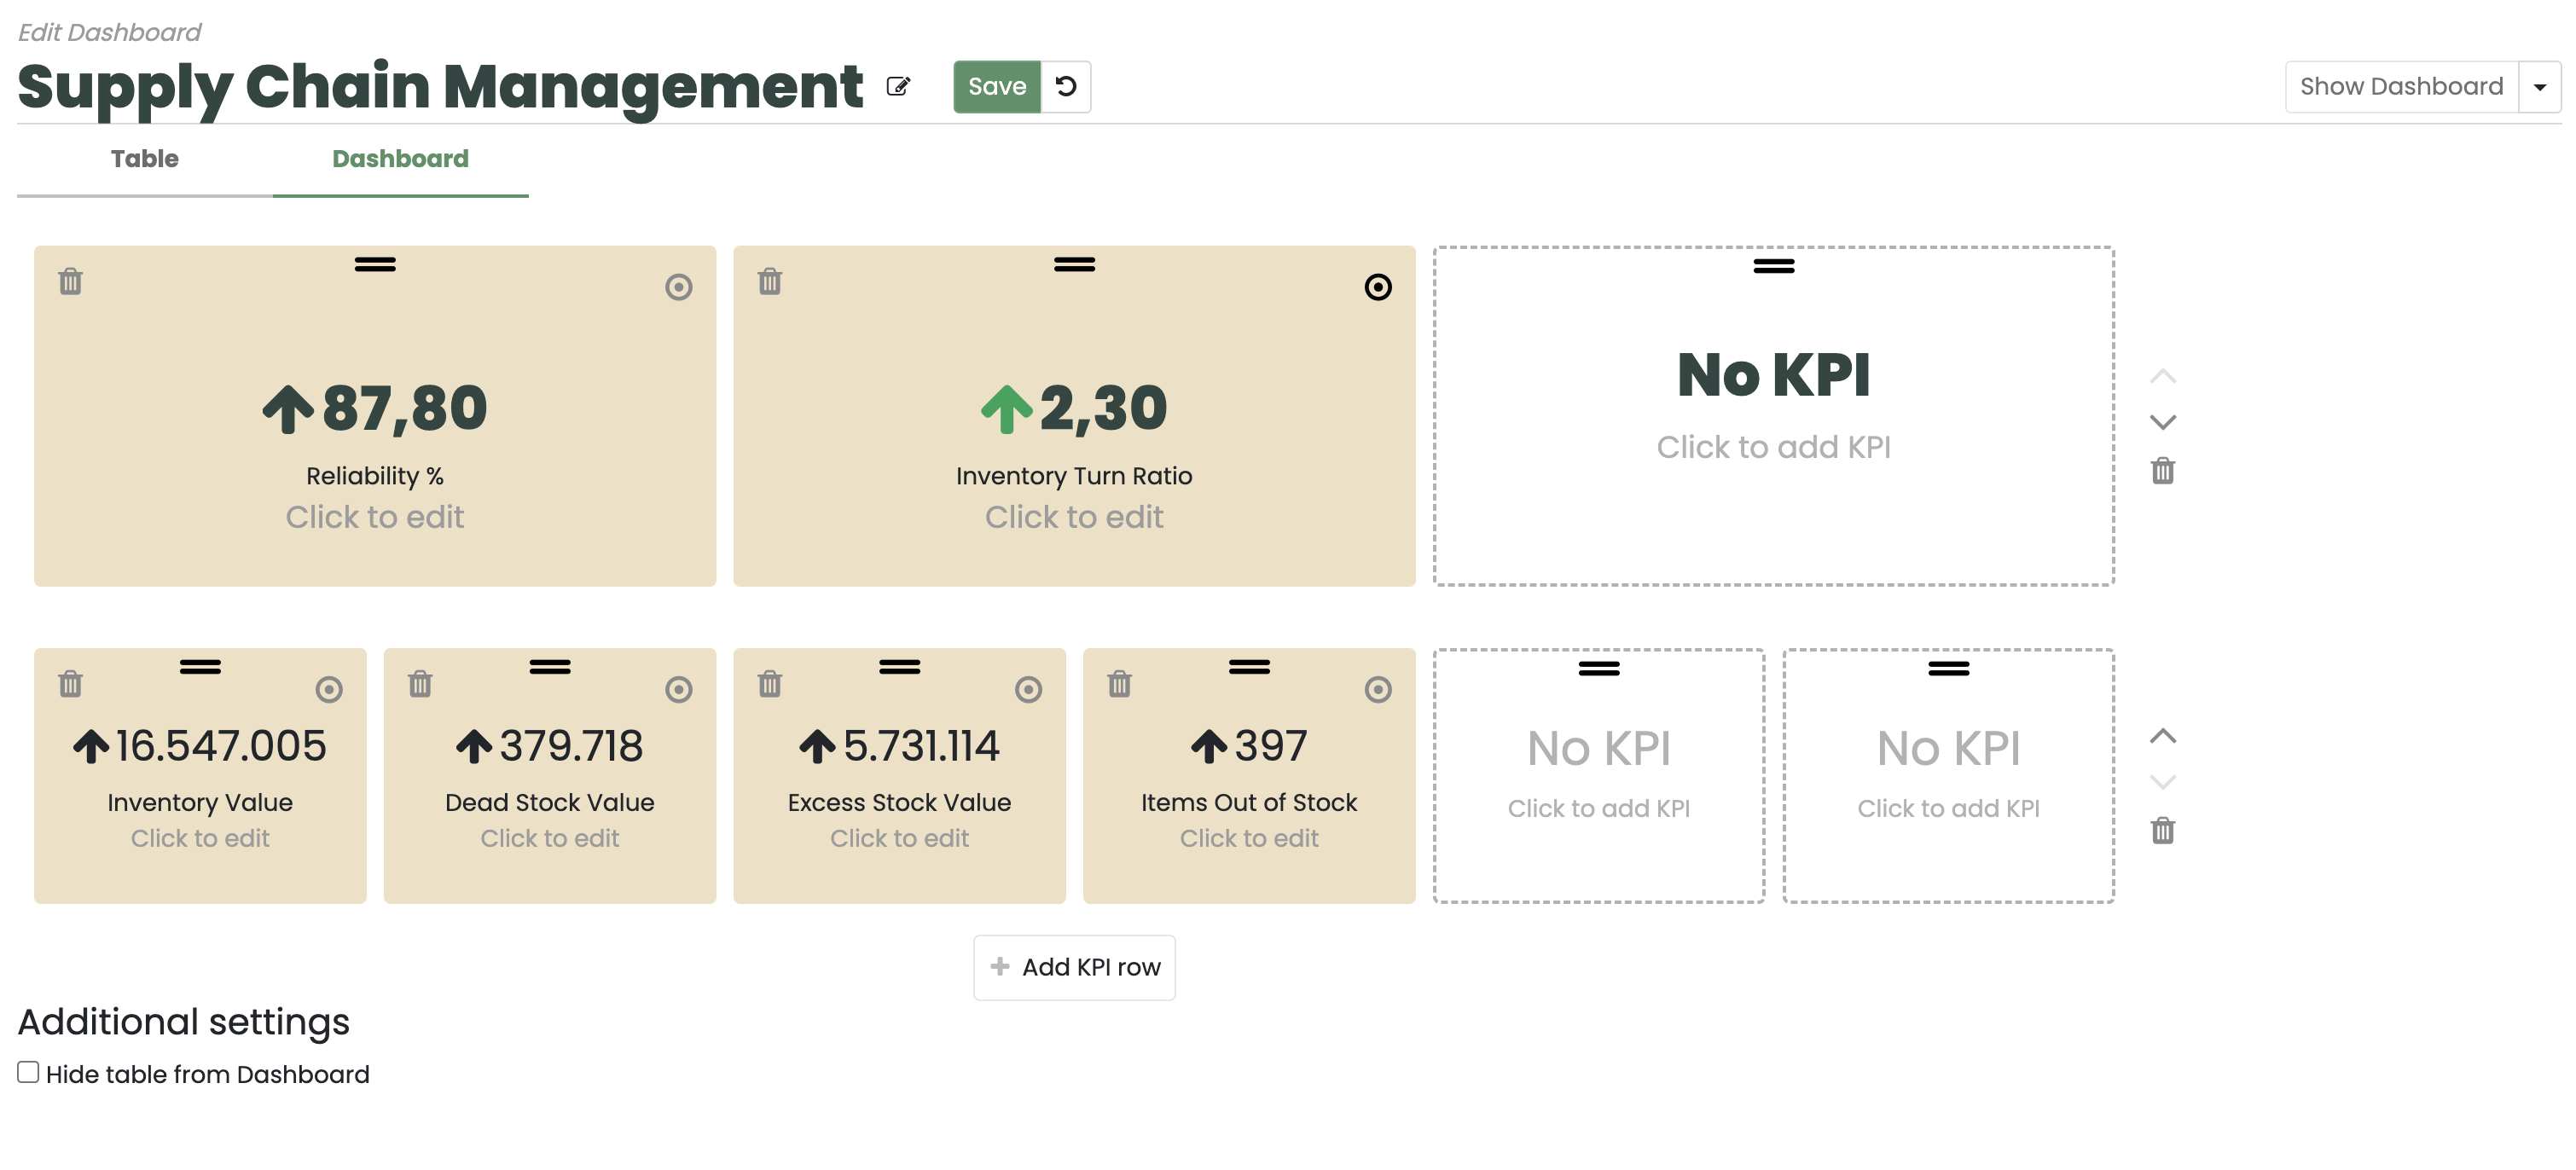
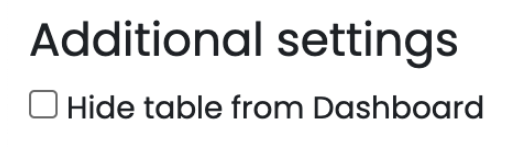
Dashboard Creator: Setting Up Widgets

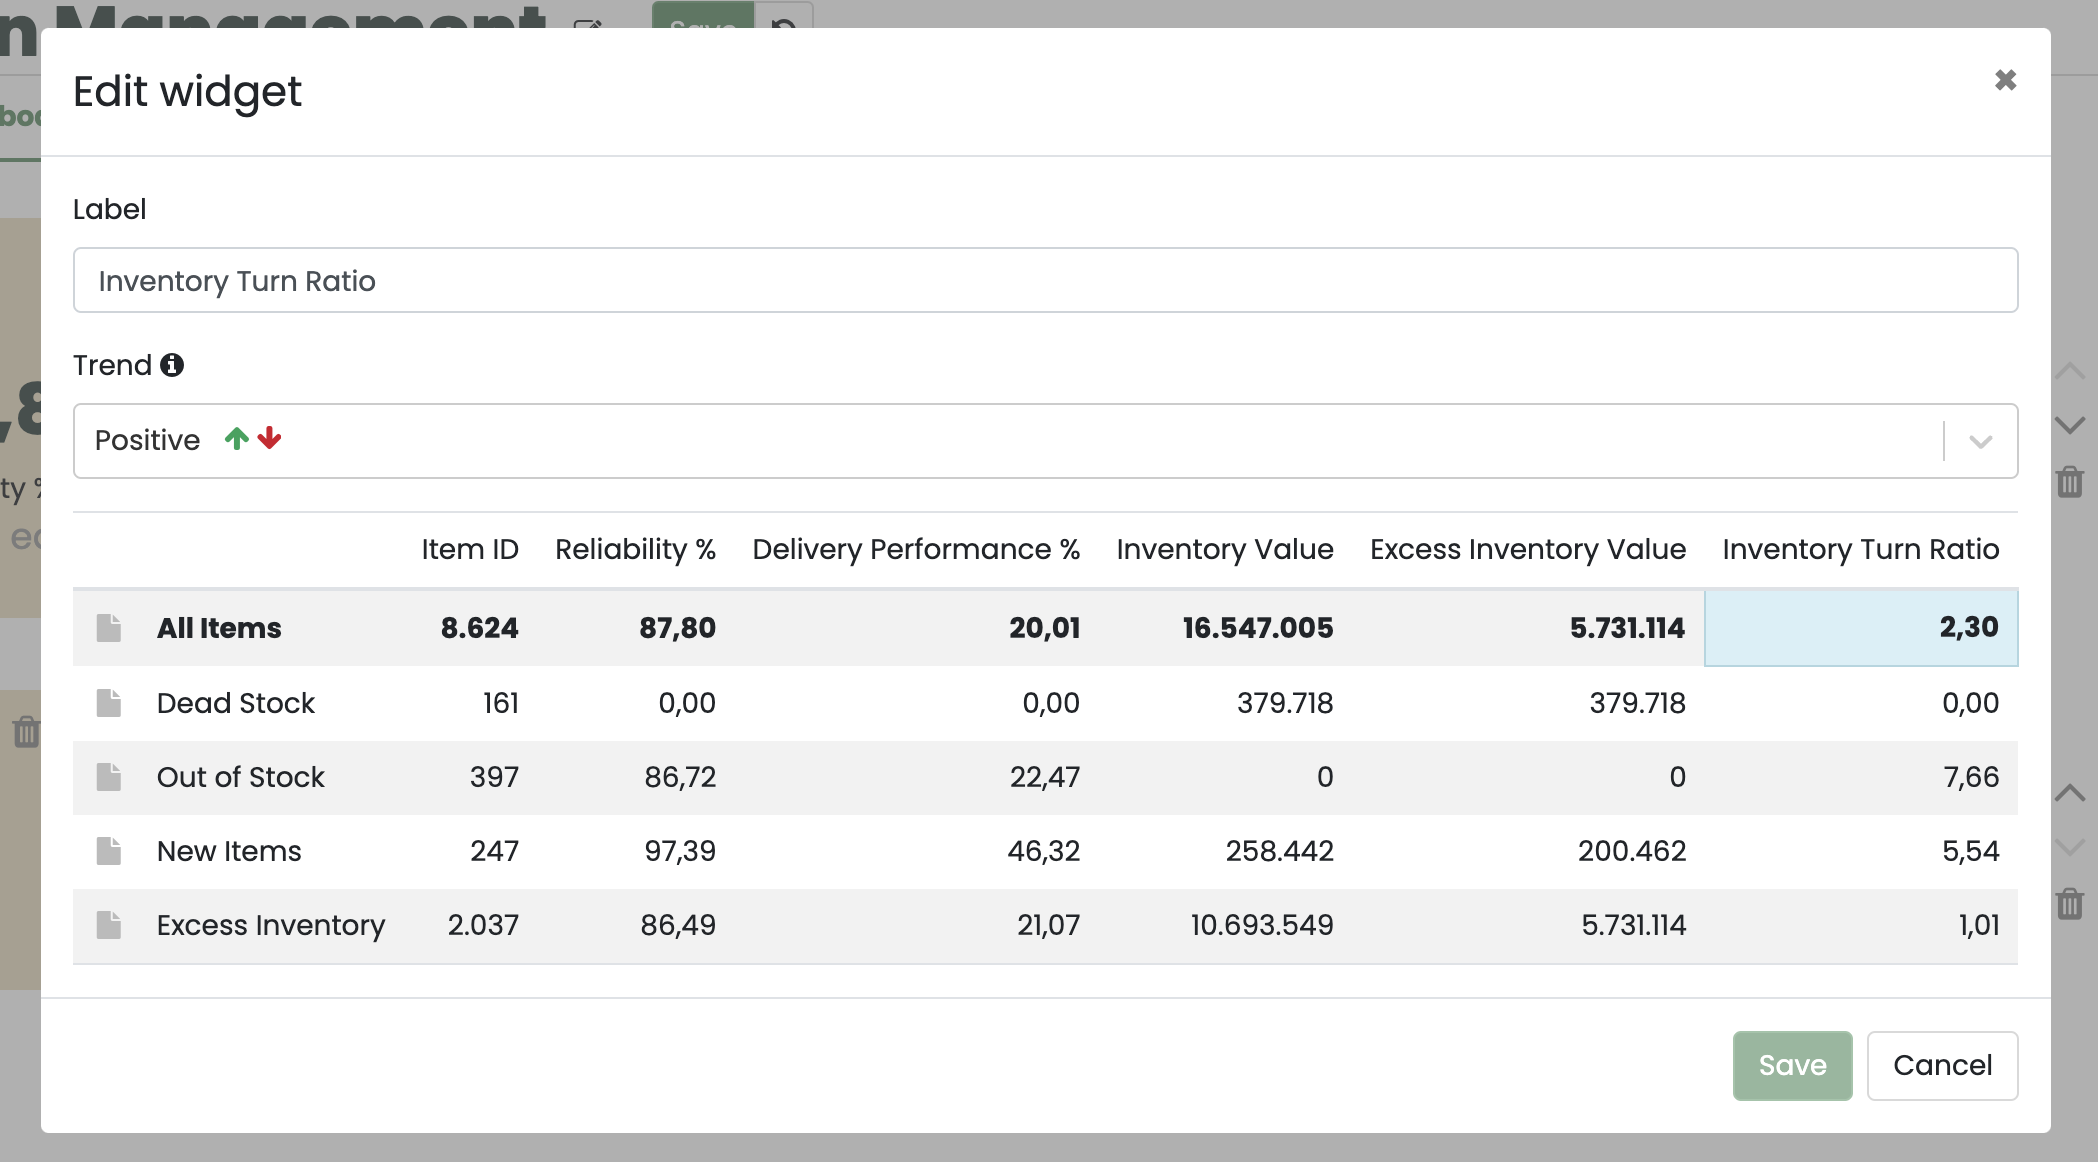
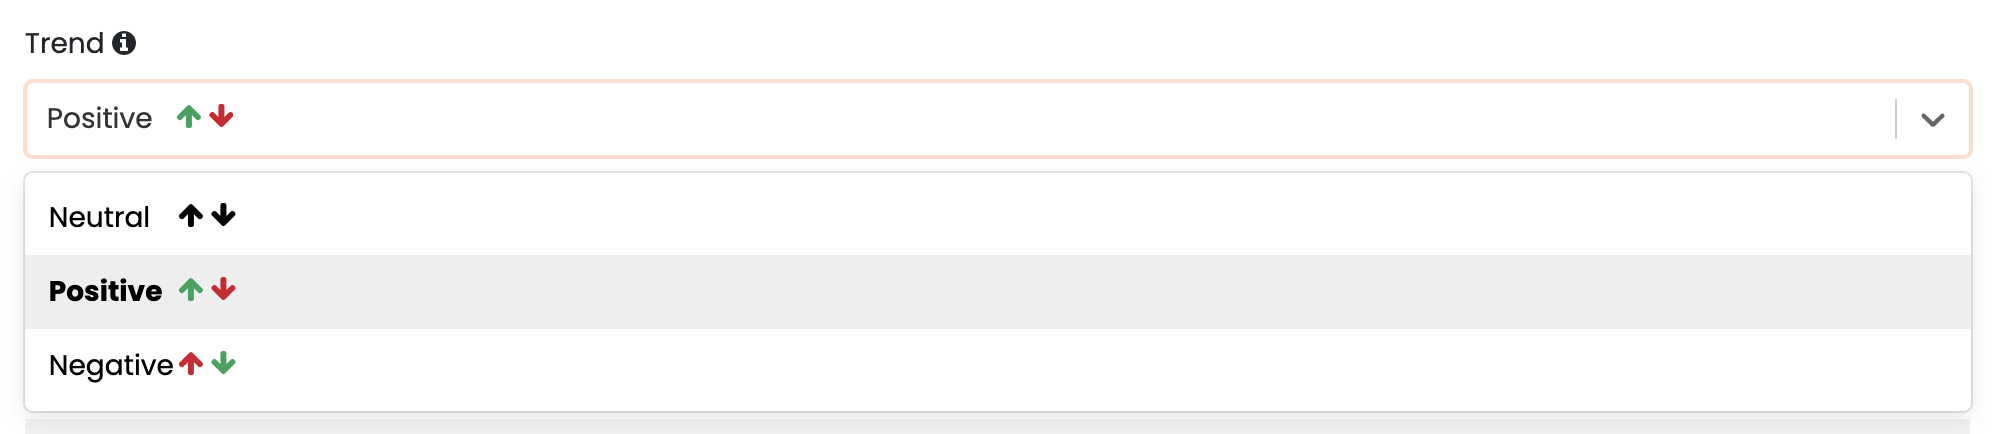
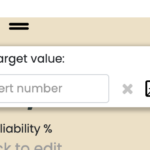
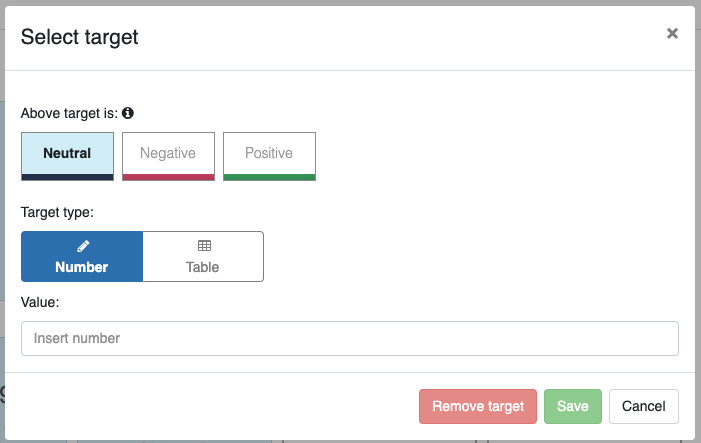
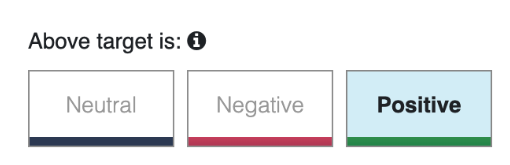
This article will guide you through the process of selecting and configuring Widgets, both large and small, as well as how to set the Target and additional customizations. To understand and get the best result, you must first have a Table to create your Dashboard from, if you need help with this,.

Get started with your Dashboards

Once you have added all your key figures in your table, you can highlight these in your Dashboard. To do this, you must first press “Add KPI Row” and then choose between two types of Widgets; the big and the small.

You can move the Widget rows around using the arrows and delete entire rows using the trash can in the menu to the right of each row.

If you regret a change, you can press the “Reset” button at the top. Here, all changes will be changed to the last time you pressed “Save”, so it may be a good idea to regularly save your setup.

Customize your Dashboard

Once you have chosen a widget type, you must choose which numbers you want highlighted. This is done by pressing your desired number in the Table.

For further modification of your Dashboard, you can choose a new Heading/Label for your Widget, this is Optional and if this is not selected, the heading will be selected from [Column label] + [Row label].

Trend on the arrow in your Dashboard. The arrow in your Dashboard shows whether your KPI has increased or decreased from the previous month. In Trend, you can choose whether it is neutral, positive or negative

Set your Target on your KPI

Setting up Targets on your Dashboard allows you to set goals or benchmarks for your data. You can set your target directly on the Dashboard Widget. If, on the other hand, Target is set in your Table, it will appear both in the table and in the Dashboard itself.

You set your Target on the Dashboard by pressing the button in the upper right corner for the desired KPI.

There are two primary types to set your target on:

Number target: A number target is the simple way to set a target, as the target here will have a fixed value that you manually set and therefore only change by entering a new Target yourself.

Table Target: Table Target is a dynamic target that points to a column in your table. In this way, your target will adapt based on the data you choose yourself. They can be linked to variables or formulas, enabling more adaptive targeting based on real-time data.

When Target is selected, the result will by default be neutral and therefore show a Dark Blue color in the bar under the Dashboard. To change this, pick a trend at Target. This is done in the menu above Target Type. Here you must choose whether the Dashboard should be positive (Green) or red (Negative) if the KPI is above target. In the picture here, the Dashboard will be green if the target has been reached.

You have the option not to show the table under your completed Dashboard, if this is desired, simply check the following button under “Additional settings”.

Leave a Reply