To create an Insight from scratch, you need to consider the following steps to get the best results:

  1. Select your Data Source
  2. Set limit on the Insight (Optional)
  3. Name and describe
  4. Select Views and visualizations
  5. Select location in the Insight overview
  6. Select KPIs
  7. Set up columns
  8. Set filters and fixed slicers
Create A Report

NB: To create an Insight you must have at least the “Insight Create”-Permission, if you have this permission you can only create Private Insights that you can access. To create Public Insights, you must be an “Insight Administrator”.

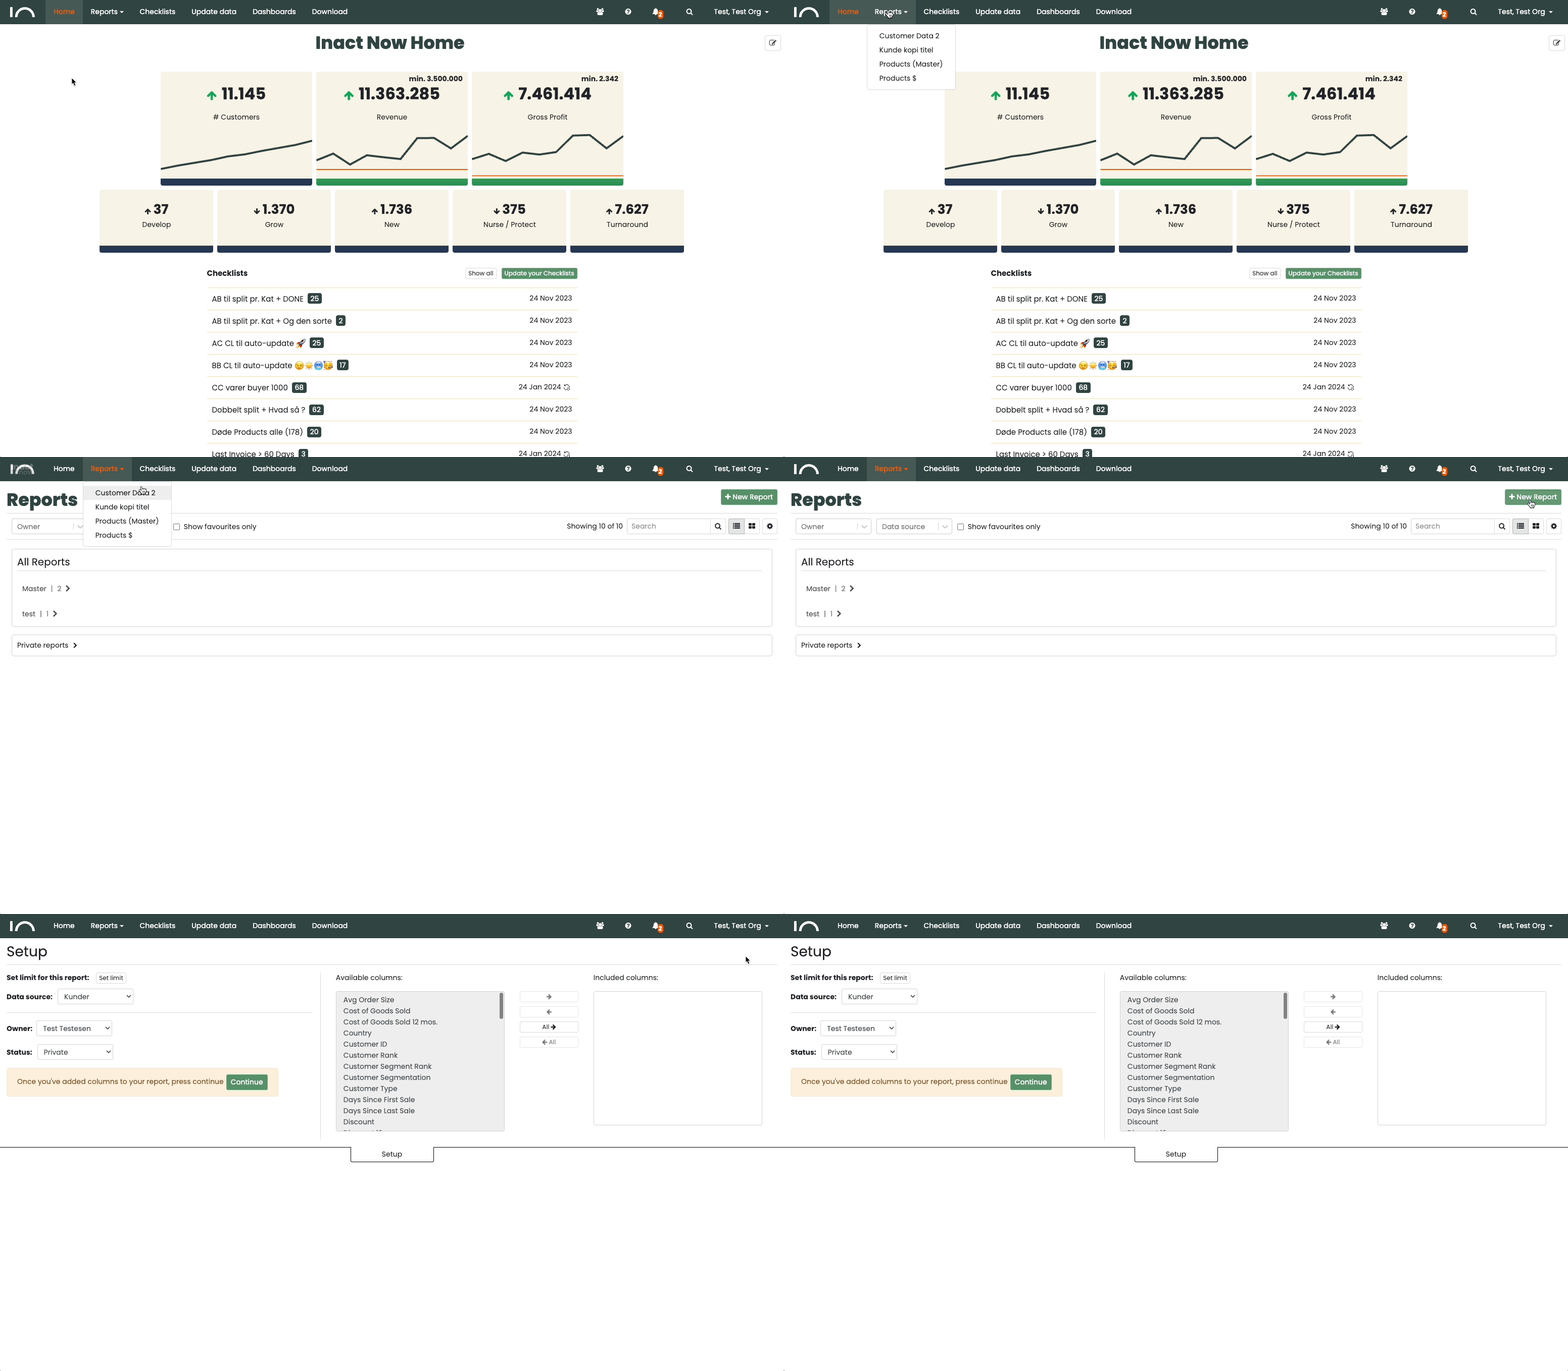
1. Choose your Data Source

The first and most important point is to select the Data Source, which is the basis for what data you can display in the Insight. Once you have selected the Data Source, you can choose which columns should be available to the users of the Insight.

You select the Data Source and columns as follows:

Choose Data

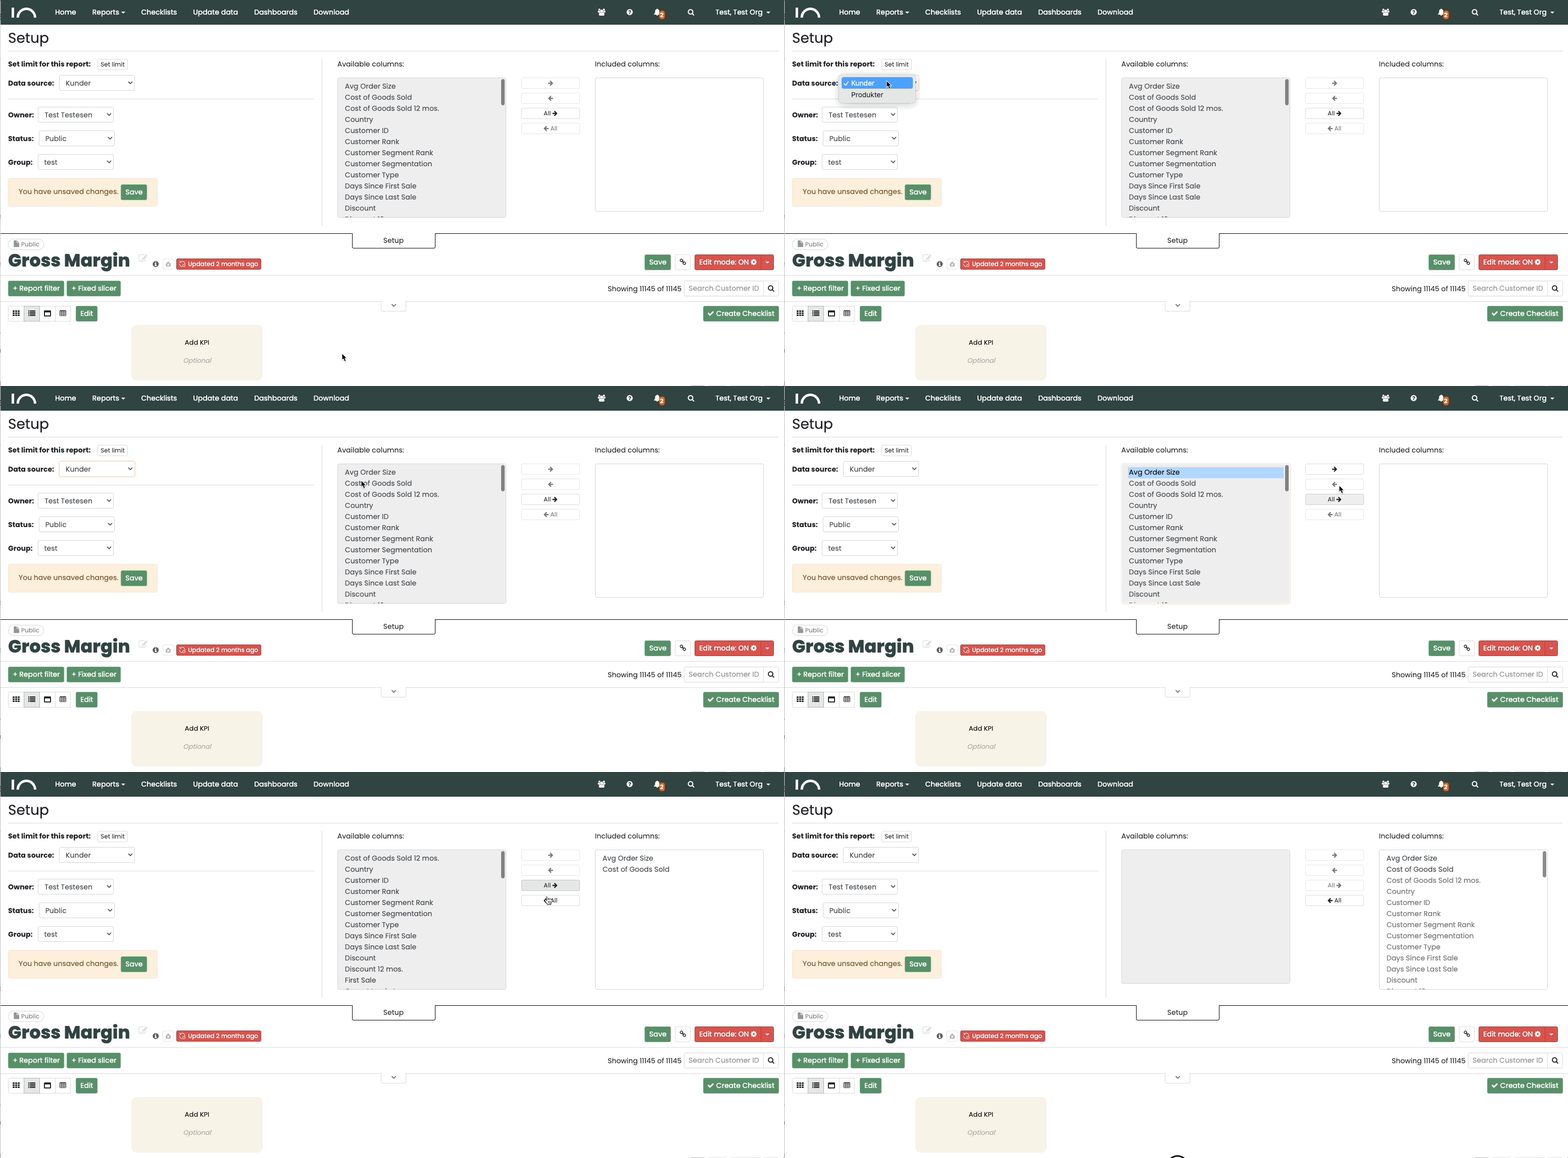
2. Set Limit on Insights (Optional)

Make the work task manageable for yourself or your colleague with a top or bottom Insight.

You can choose how many items your top/bottom Insights should contain from 5 items up to 100 items.

Examples of popular top/bottom lists:

  • Top 25: Dead stock measured by e.g. inventory value.
  • Top 100: Customers measured by e.g. revenue.
  • Bottom 50: Customers measured by e.g. contribution margin.
  • Top 50: Overstock measured by e.g. inventory value.

See how to do it here:

SetLimit

3. Name and describe

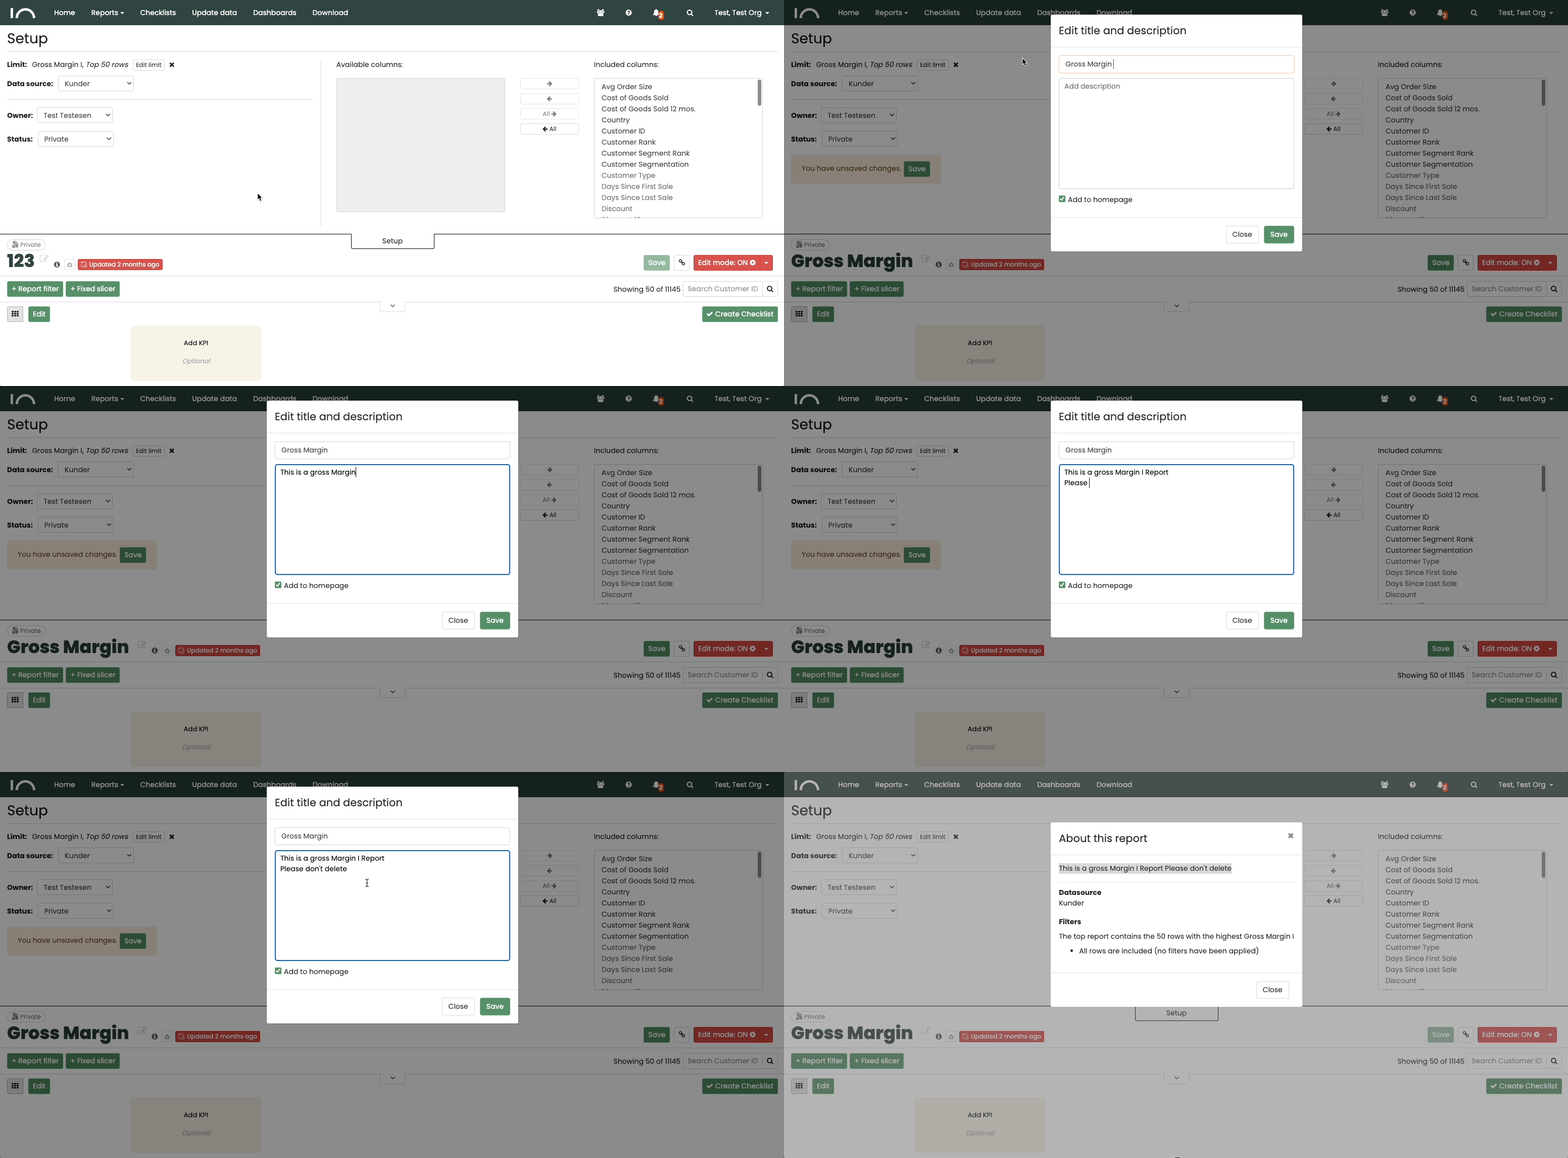
It’s a good idea to name and describe the content of the Insight so that there is no doubt about the criteria used to create the Insight.

Users can see the description and criteria for the Insights marked with an “i”.

You change the name and description as follows:

Naming And Decription

4. Select Views and visualizations

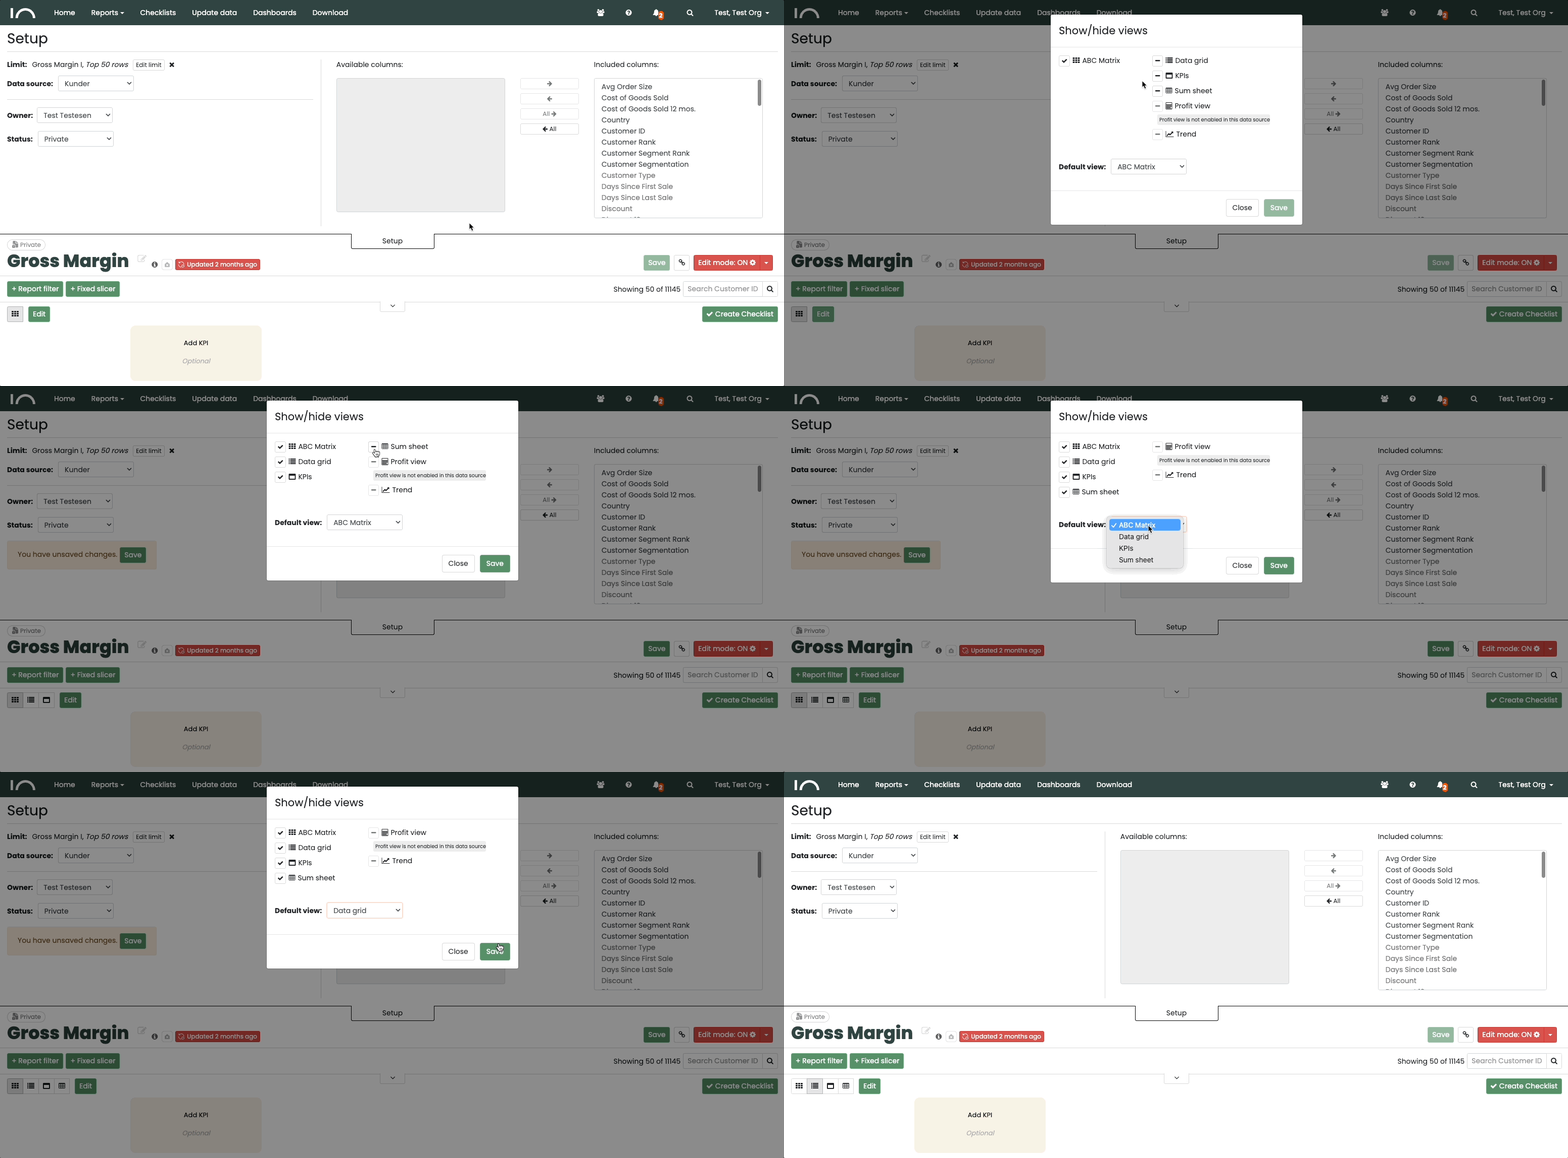
The Insight can visualize your data in 6 different ways. Depending on the purpose of the Insight, one or more of these views can be enabled or disabled by your administrator.

Read about the 6 views and how to use them in this article:

The foundation and structure of the Insight.

Set Views

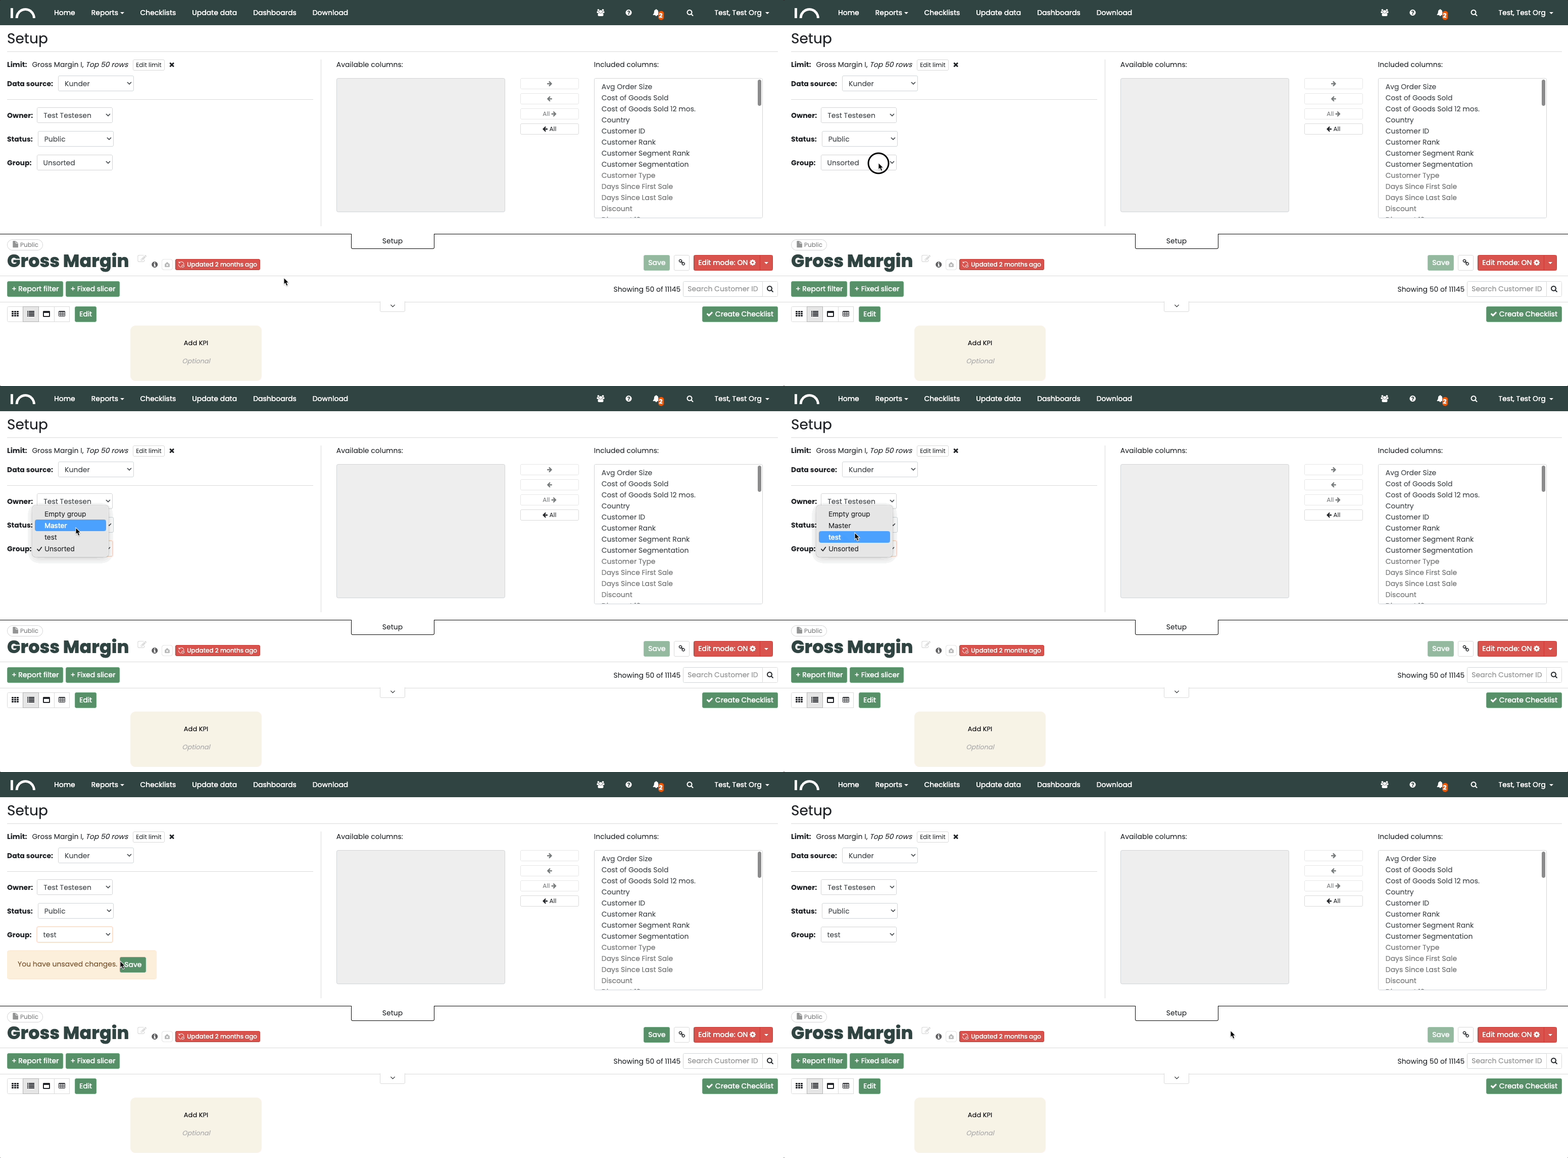
5. Select a location in the Insight Overview

All Insights can be divided into groups in the Insight overview depending on the Insight’s purpose and/or organizational ownership.

You can choose which group each Insight should be in as follows:

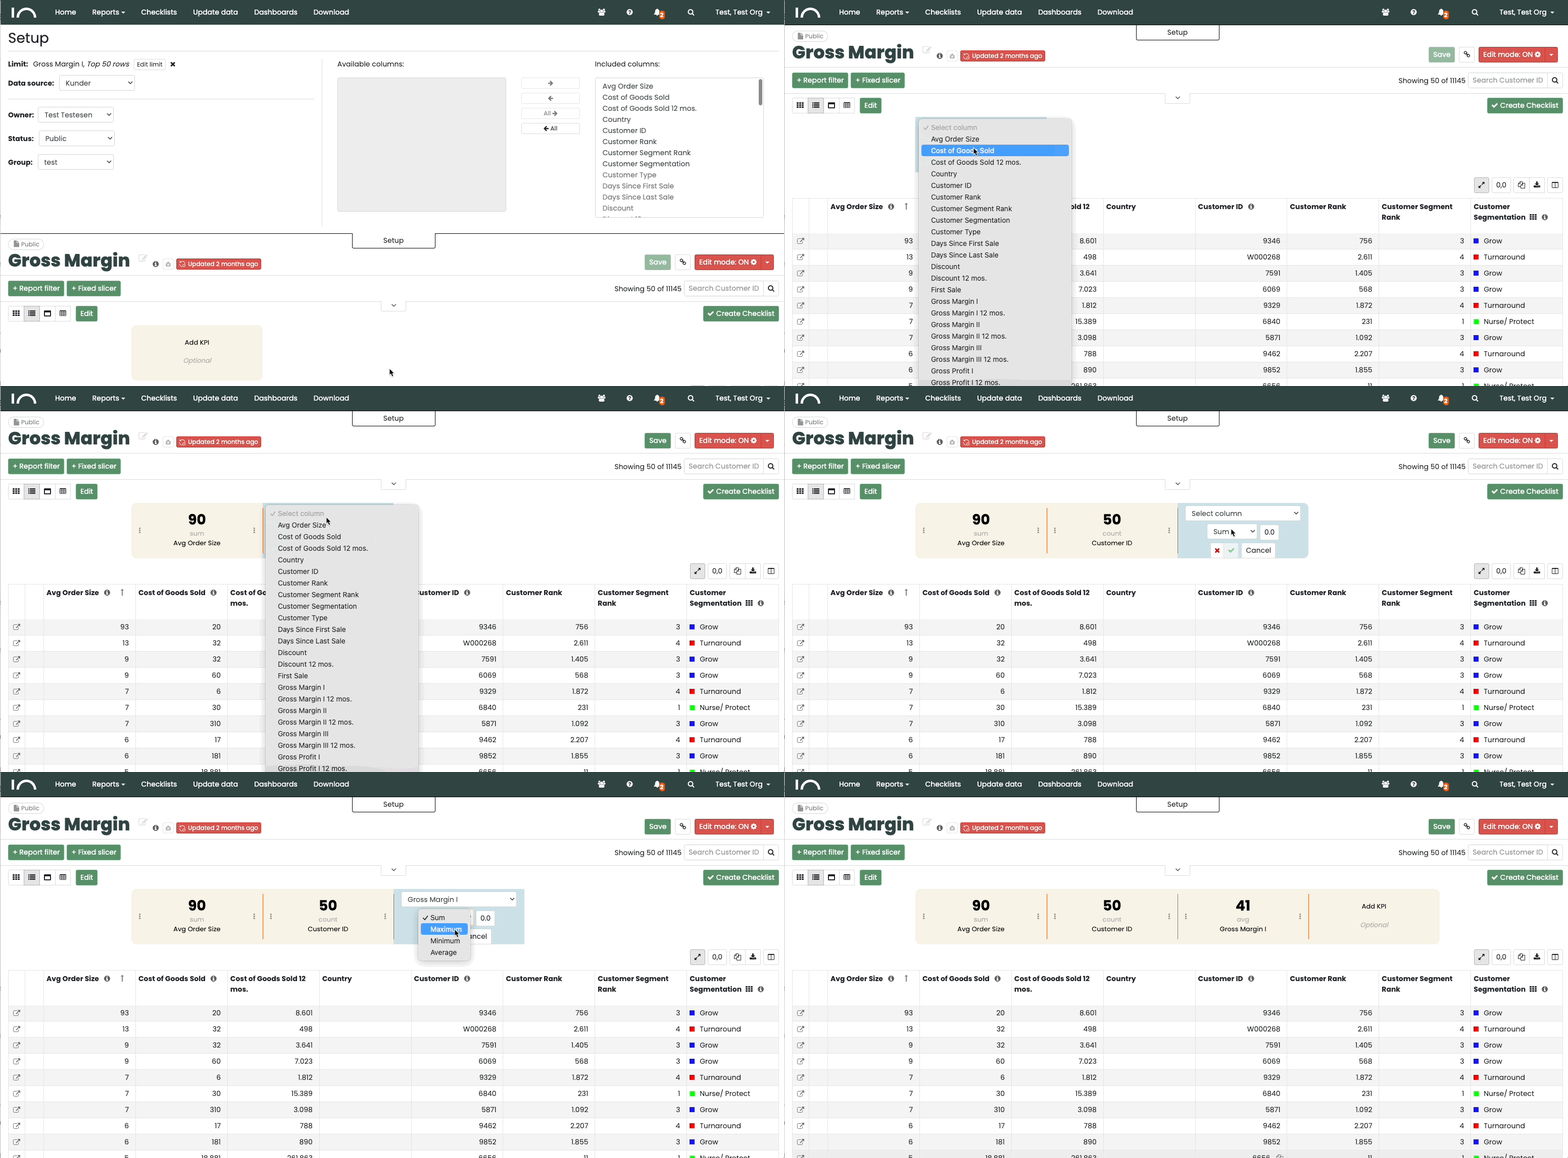
6. Select KPIs

When you insert KPIs in your Insight, you can follow
their development in the Trend view, among other things.

You can select a maximum of four KPIs, so choose them carefully as these are the most important values in your Insight, especially in the Trend view.

Choose KPI

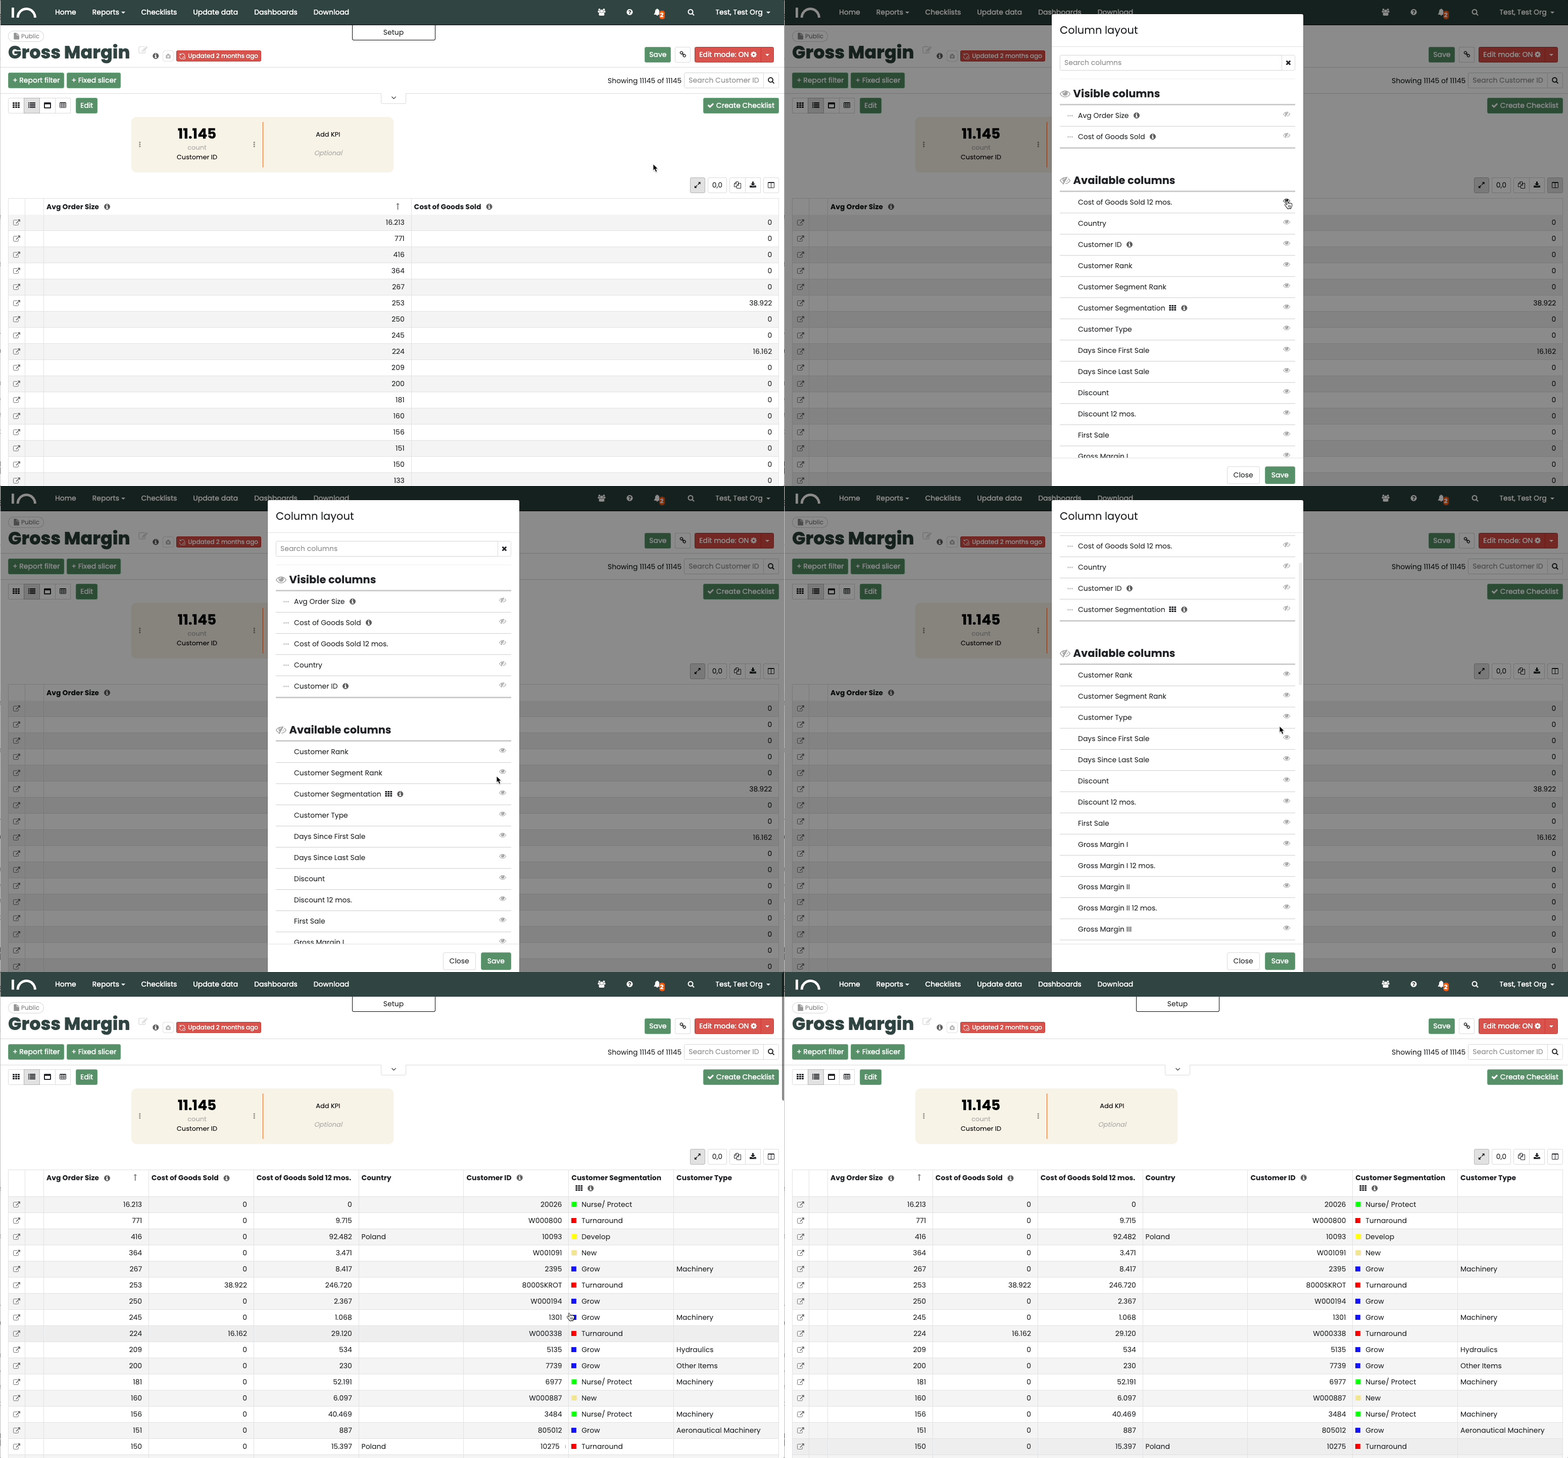
7. Set up columns

The user must have the right columns available in the Insight.

Unlike the first step in this guide “1. Select your Data”, here you need to choose which columns are visible.
Make sure that the columns are adapted to the purpose of the Insight so that the Insight is as easy and quick to work with as possible.

NB: Remember to finalize and save your setup via the Edit mode button.

Choose Column

8. Set filters and fixed slicers

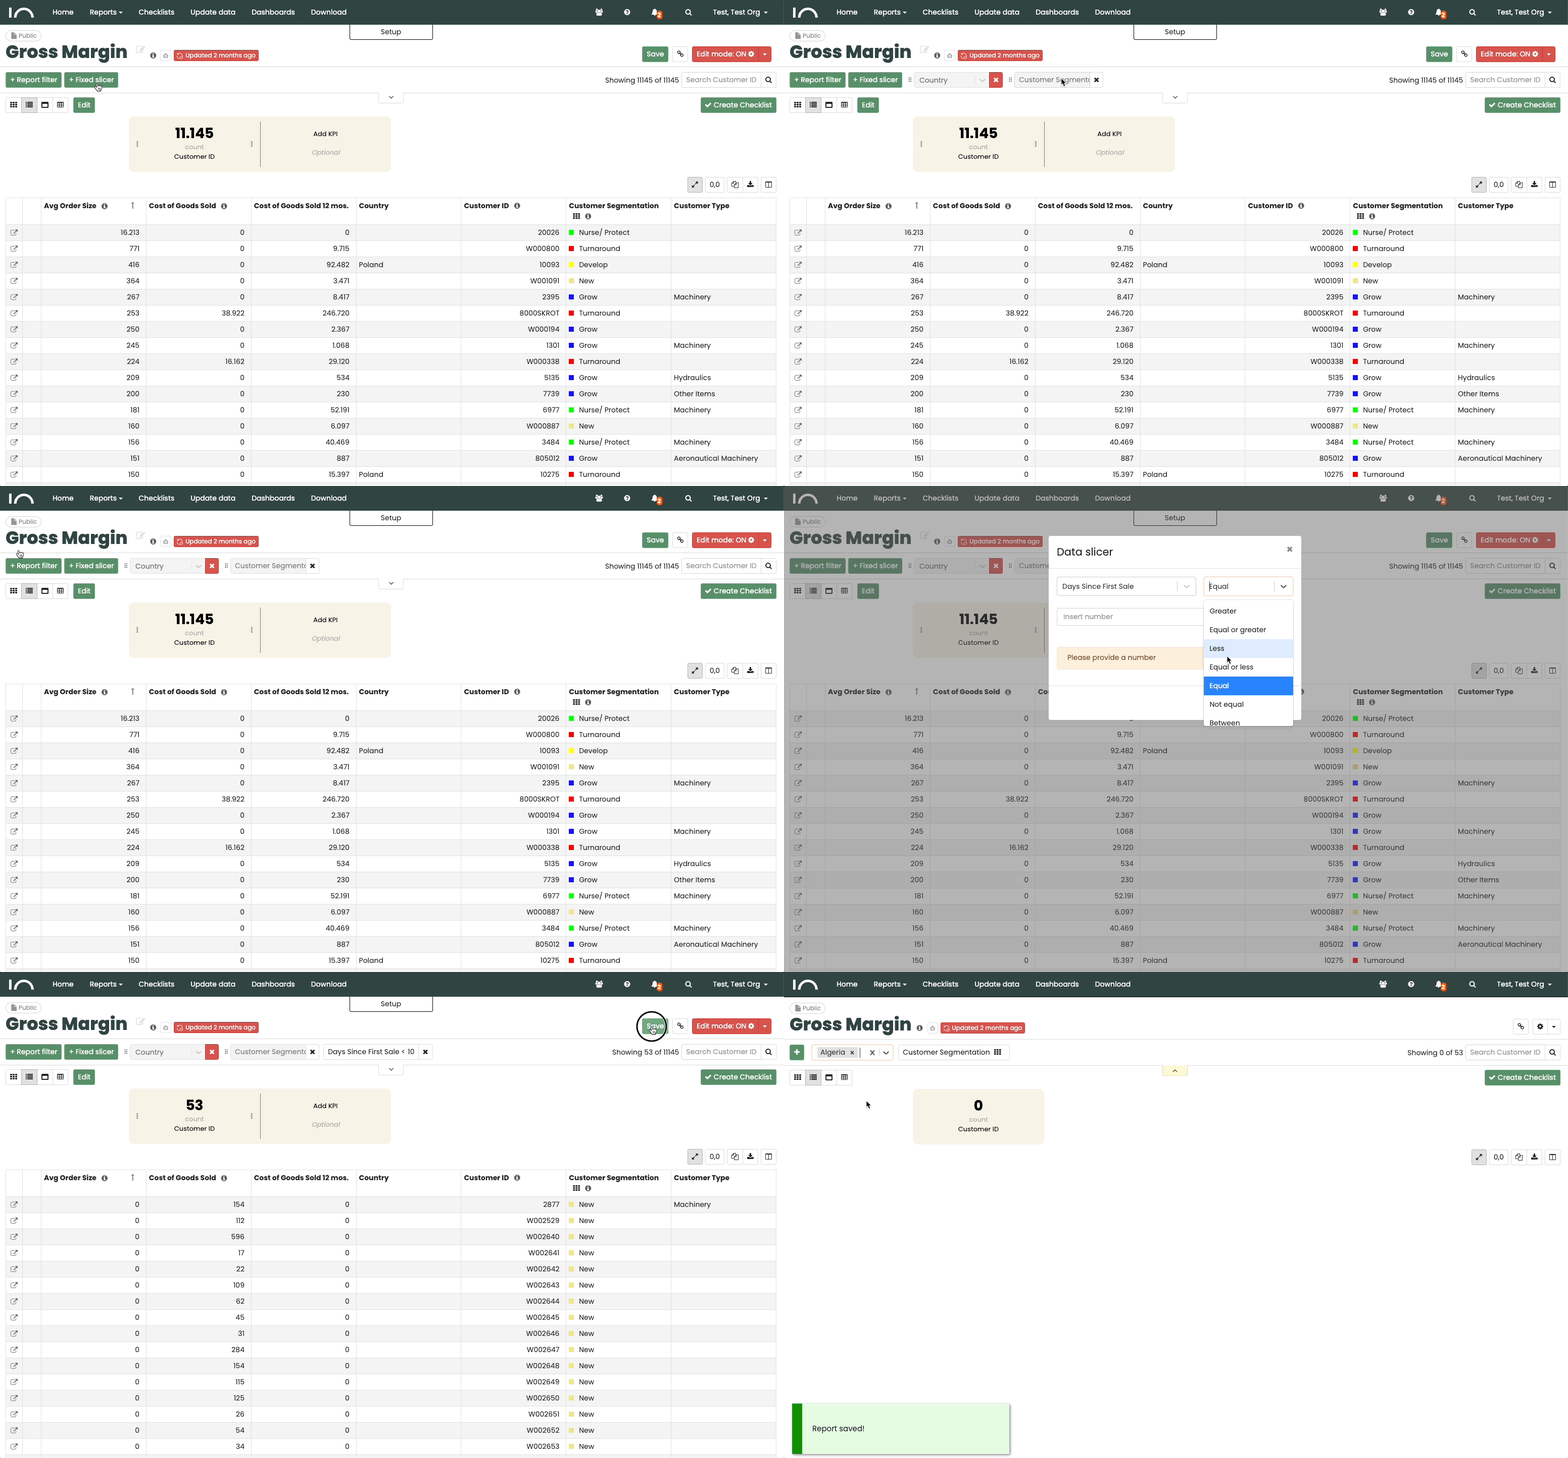
To customize the Insight to fit what you want to analyze, you can set up Slicers. If these slices are set and saved in Edit mode, they will appear permanently on the Insight.

Admin can use an Insight filter to limit the Insight. For example, if the Insight filter is set to “Buyer Equal(=) 1000”, the Insight is limited to only contain item numbers that belong to Buyer 1000.
Fixed Slicer The administrator sets up the user slicer to be fixed in the Insight menu so that future users will be able to filter on e.g. quickly:

  • ID for customer, supplier or item number.
  • Group, for example, customer, supplier or product group
  • Responsible for example salesperson, buyer or category manager.
Setup filters and slicers

Leave a Reply